get this FREE widget for your website
Get a Custom Widget for Your Website
Add a Custom Widget to Your Site for Just $15/mo
Grains Prices
Week
Month
Year
Three Years
Five Years
Yield Curve
12-Jul-25
11-Jul-25
Chg
5-Jul-25
Chg
12-Jun-25
Chg
12-Jul-24
Chg
Canola - ICE - C$/mt
682.70
685.10
-2.40
719.70
-37.00
693.90
-11.20
622.20
60.50
Corn cents/bu - cbot
412.25
416.50
-4.25
437.00
-24.75
437.00
-24.75
410.75
1.50
Corn-Liffe-€/mt
200.50
201.25
-0.75
203.50
-3.00
186.00
14.50
211.50
-11.00
Oats $/b - cbot
3.6325
3.6975
-0.0650
3.8200
-0.1875
3.7625
-0.1300
3.1825
0.4500
Rapeseed-Liffe-€/mt
475.50
476.50
-1.00
465.50
10.00
483.25
-7.75
482.50
-7.00
Rice cents/cwt - cbot
12.780
12.920
-0.140
12.960
-0.180
13.590
-0.810
14.640
-1.860
Soy oil cents/lb - cbot
53.65
53.47
0.18
54.67
-1.02
48.02
5.63
46.15
7.50
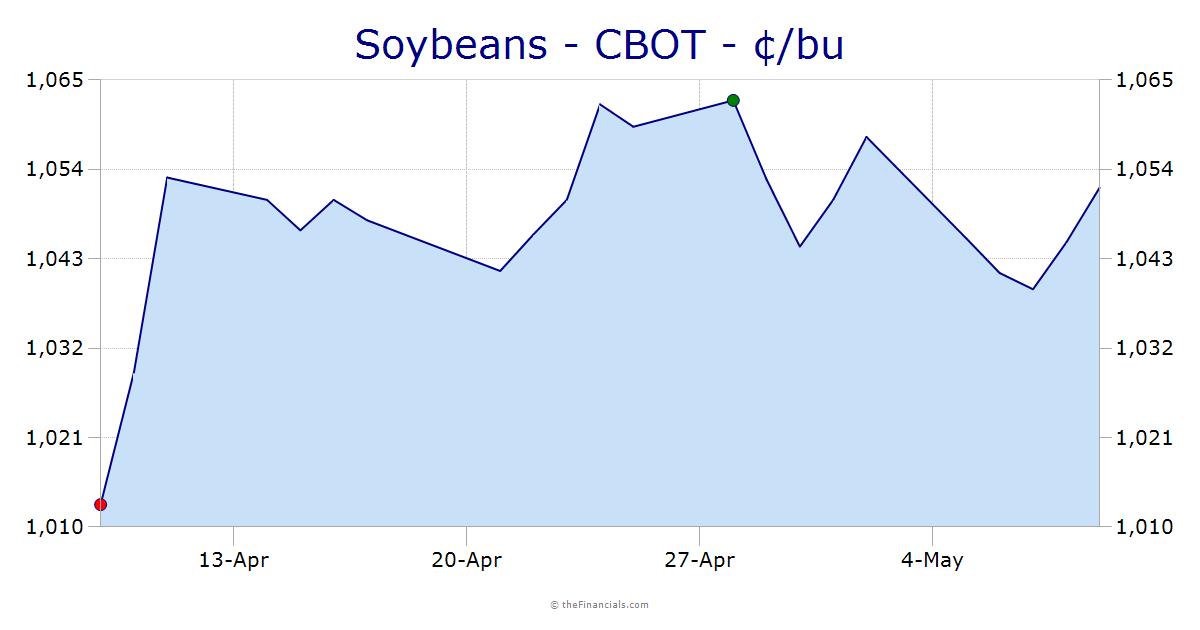
Soybeans cents/bu - cbot
1,007.25
1,013.75
-6.50
1,049.25
-42.00
1,050.50
-43.25
1,067.75
-60.50
Soymeal $/t - cbot
283.60
285.30
-1.70
292.20
-8.60
294.20
-10.60
315.50
-31.90
Wheat cents/bu - cbot
545.00
554.50
-9.50
556.75
-11.75
534.25
10.75
571.25
-26.25
Wheat-Liffe
201.00
201.25
-0.25
195.75
5.25
199.50
1.50
231.75
-30.75
view history
© theFinancials.com