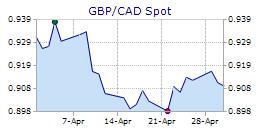
Sterling Commentary for 20-Apr-10


Sterling Commentary
Tables & Charts

The British pound depreciated vis-à-vis the U.S. dollar today as cable tested bids around the US$ 1.5190 level and was capped around the $1.5340 level. Data to be released in the U.K. tomorrow include March consumer price inflation. Prime Minister Brown and Tory leader Cameron debated last week ahead of the 6 May general election. Many political pundits believe the contest will result in a hung Parliament and some now say the general election is too close to call with Cameron perhaps still holding a slight lead over Brown. Data released in the U.K. last week saw March Nationwide consumer confidence print at 72, down from a revised +81. Cable bids are cited around the US$ 1.5140 level. The euro moved higher vis-à-vis the British pound as the single currency tested offers around the £0.8840 level and was supported around the £0.8785 level.

SUPPORT   RESISTANCE

L1. 1.4855 1.5620

L2. 1.4720 1.5880

L3. 1.4585 1.6215


Sterling Focus
 
Day's Change 52-Week High 52-Week Low

Instrument

Current

Points % Date Value Date Value
Exchange Rates

20-Apr-10

EUR/GBP Fwd-1 Yr This marker indicates the current chart. 6.0000 0.0000 0.00% 29-Jan-10 281.0000
GBP/AUD This marker indicates the current chart. 1.6533 0.0015 0.09% 9-Jul-09 2.0830 29-Mar-10 1.6319
GBP/CAD This marker indicates the current chart. 1.5568 0.0041 0.26% 29-Jun-09 1.9218 25-Mar-10 1.5195
GBP/CHF This marker indicates the current chart. 1.6322 0.0030 0.18% 7-Aug-09 1.8035 26-Mar-10 1.5862
GBP/EUR This marker indicates the current chart. 1.1392 0.0019 0.17% 16-Jun-09 1.1840 12-Oct-09 1.0693
GBP/JPY This marker indicates the current chart. 142.7700 0.8700 0.61% 7-Aug-09 162.7200 1-Mar-10 133.3200
GBP/USD Fwd-1 Yr This marker indicates the current chart. -28.8000 0.0000 0.00% 18-Sep-09 3.4000 24-Nov-09 -66.5000
USD/GBP This marker indicates the current chart. 0.6498 -0.0028 -0.43% 22-Apr-09 0.6903 5-Aug-09 0.5889
 
Interest Rates

20-Apr-10

USD 3M LIBOR This marker indicates the current chart. 0.3100% 0.0050% 1.61% 20-Apr-09 1.1010% 3-Feb-10 0.2490%
 
Indices

20-Apr-10

NASDAQ This marker indicates the current chart. 2,480.11 0.00 0.00% 15-Apr-10 2,515.69 20-Apr-09 1,608.21
 

source: DTN Market Access


top

© theFinancials.com
All rights reserved.
  Republication or redistribution of this content is expressly prohibited without the prior written consent of theFinancials.com.

DISCLAIMER: Commentary and market information is provided for informational purposes only.  The information contained in this report is gathered from reputable sources and is not intended to be used as investment advice.  theFinancials.com assumes no responsibility or liability from gains or losses incurred by the information herein contained.