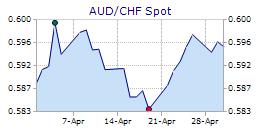
Swiss Franc Commentary for 20-Apr-10


Swiss Franc Commentary
Tables & Charts

The Swiss franc depreciated vis-ŕ-vis the U.S. dollar today as the greenback tested offers around the CHF 1.0690 level and was supported around the CHF 1.0615 level. Data released in Switzerland last week saw March producer and import prices climb 0.5% m/m and 0.0% y/y. Swiss National Bank Vice Chairman Jordan last week said regulators cannot allow governments to be “blackmailed” into protecting banks from collapse during future financial crises. There was talk yesterday that the Swiss National Bank may have sold francs for euro this week in an intervention to try and support the Swiss export sector. U.S. dollar offers are cited around the CHF 1.0920 level. The euro moved lower vis-ŕ-vis the Swiss franc as the single currency tested bids around the CHF 1.4360 level while the British pound moved lower vis-ŕ-vis the Swiss franc and tested bids around the CHF 1.6205 level.

SUPPORT   RESISTANCE

L1. 1.0405 1.0830

L2. 1.0290 1.0940

L3. 1.0040 1.1045


Swiss Franc Focus
 
Day's Change 52-Week High 52-Week Low

Instrument

Current

Points % Date Value Date Value
Exchange Rates

20-Apr-10

AUD/CHF This marker indicates the current chart. 0.9898 0.0035 0.35% 7-Apr-10 0.9971 27-Apr-09 0.8136
CAD/CHF This marker indicates the current chart. 1.0524 0.0032 0.31% 8-Apr-10 1.0709 23-Jun-09 0.9291
CHF/JPY This marker indicates the current chart. 87.2720 0.1704 0.20% 11-Jun-09 91.2775 1-Mar-10 82.5388
EUR/CHF Fwd-1 Yr This marker indicates the current chart. 77.0000 0.0000 0.00% 8-Jun-09 175.0000 16-Apr-10 75.0000
GBP/CHF This marker indicates the current chart. 1.6322 0.0030 0.18% 7-Aug-09 1.8035 26-Mar-10 1.5862
USD/CHF This marker indicates the current chart. 1.0635 0.0001 0.01% 20-Apr-09 1.1685 25-Nov-09 0.9943
USD/CHF Fwd-1 Yr This marker indicates the current chart. -52.0000 0.0000 0.00% 25-Nov-09 -36.3000 21-Apr-09 -118.0000
EUR/CHF This marker indicates the current chart. 1.4330 0.0000 0.00% 10-Aug-09 1.5340 31-Mar-10 1.4222
 
Indices

20-Apr-10

NASDAQ This marker indicates the current chart. 2,480.11 0.00 0.00% 15-Apr-10 2,515.69 20-Apr-09 1,608.21
S&P 500 This marker indicates the current chart. 1,197.52 0.00 0.00% 15-Apr-10 1,211.67 20-Apr-09 832.39
 

source: DTN Market Access


top

© theFinancials.com
All rights reserved.
  Republication or redistribution of this content is expressly prohibited without the prior written consent of theFinancials.com.

DISCLAIMER: Commentary and market information is provided for informational purposes only.  The information contained in this report is gathered from reputable sources and is not intended to be used as investment advice.  theFinancials.com assumes no responsibility or liability from gains or losses incurred by the information herein contained.