Sterling Commentary for 8-Jun-11

Receive this report via email for free

Compelling Content for Websites & Investors

Show this report on your site
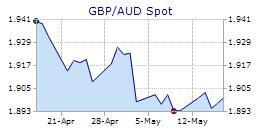
Sterling Commentary provided by GCI Financial Ltd:
Tables & Charts

The British pound depreciated vis-à-vis the U.S. dollar today as cable tested bids around the US$ 1.5340 level and was capped around the $1.5470 level. Data released in the U.K. today saw March retail sales climb 0.4% m/m and 2.2% y/y while the March public sector net cash requirement grew to £25.8 billion from February’s level of £8.0 billion. Also, March public sector net borrowing printed at £23.5 billion, up from the prior reading of £9.7 billion. Additionally, March mortgage approvals grew marginally to 52,000 from the prior reading of 48,000 and the March M4 money supply expanded 0.1% m/m and 3.5% y/y. Minutes from Bank of England Monetary Policy Committee’s April meeting were released yesterday and they revealed a unanimous vote to keep interest rates unchanged...continued 


Sterling Focus
 
Day's Change 52-Week High 52-Week Low

Instrument

Current

Points % Date Value Date Value
Exchange Rates

8-Jun-11

EUR/GBP Fwd-1 Yr This marker indicates the current chart. 67.0000 0.0000 0.00% 28-Sep-10 2,723.0000
GBP/AUD This marker indicates the current chart. 1.5405 0.0002 0.01% 5-Jul-10 1.8080 10-May-11 1.5070
GBP/CAD This marker indicates the current chart. 1.6050 0.0001 0.01% 25-Aug-10 1.6431 11-Jun-10 1.5025
GBP/CHF This marker indicates the current chart. 1.3697 -0.0034 -0.25% 14-Jun-10 1.6831 6-Jun-11 1.3645
GBP/EUR This marker indicates the current chart. 1.1178 -0.0028 -0.25% 29-Jun-10 1.2340 4-May-11 1.1123
GBP/JPY This marker indicates the current chart. 130.8100 -0.3900 -0.30% 7-Apr-11 139.4700 30-Dec-10 125.7400
GBP/USD Fwd-1 Yr This marker indicates the current chart. -98.9000 0.0000 0.00% 8-Jun-10 9.1000 5-Apr-11 -136.0000
USD/GBP This marker indicates the current chart. 0.6103 0.0012 0.19% 8-Jun-10 0.6926 27-Apr-11 0.5979
 
Interest Rates

8-Jun-11

LIBOR 3 Month This marker indicates the current chart. 0.2520% 0.0000% 0.00% 16-Jun-10 0.5390% 30-May-11 0.2500%
 
Indices

8-Jun-11

NASDAQ This marker indicates the current chart. 2,701.56 -1.00 -0.04% 29-Apr-11 2,873.54 2-Jul-10 2,091.79
 

source: DTN Market Access


part 1...and the central bank’s asset purchase plan unchanged at £200 billion. Traders are talking about a surge in the polls by the Liberal Democratic Party and the likely impact this will have on the 6 May General Election. Many political pundits believe the contest will result in a hung Parliament and some now say the general election is too close to call with Cameron perhaps still holding a slight lead over Brown. Cable bids are cited around the US$ 1.5140 level. The euro moved lower vis-à-vis the British pound as the single currency tested bids around the £0.8630 level and was capped around the £0.8695 level.

SUPPORT   RESISTANCE

L1. 1.4855 1.5620

L2. 1.4720 1.5880

L3. 1.4585 1.6215

top

Receive this report via email for free

GCI Financial Ltd is a leading provider of professionally- managed foreign exchange investment services and offers a comprehensive online foreign exchange trading/ dealing platform for individual and institutional clients. www.gcitrading.com.

© 2002 theFinancials.com & GCI Financial Ltd
All rights reserved.
  Republication or redistribution of this content is expressly prohibited without the prior written consent of theFinancials.com & GCI Financial Ltd

DISCLAIMER: Commentary and market information is provided for informational purposes only.  The information contained in this report is gathered from reputable sources and is not intended to be used as investment advice.  theFinancials.com assumes no responsibility or liability from gains or losses incurred by the information herein contained.